24 April 2024 by Georgie Tugwell

This blog is the second in a four-part series and we recommend reading ‘A novel Biodiversity Baselining Approach’ first to fully understand the biodiversity baselining package and its objectives. Here, we dive into the biodiversity baselining metrics assessed by the package, specifically the monitoring, reporting and verification (MRV) approach for pollinators and detritivores.
Who Are We?
An introduction to the biodiversity baselining developers:
The strategic partnership between rePLANET and Mozaic Earth combines technological and ecological expertise to revolutionise biodiversity quantification.
Why Measure Five Metrics?
Our baselining package uses the Wallacea Trust methodology to quantify biodiversity within geographically defined project boundaries. As part of our monitoring solution, we therefore assess five unique biodiversity metrics; these are environmental variables that inform provide information about overall ecosystem health. One structural metric must be monitored alongside four non-structural metrics, a structural metric has a major influence on all biodiversity across the project site e.g. coral reef rugosity or forest canopy cover whilst a non-structural metric encompasses species richness and relative abundance within a given taxon e.g. soil invertebrates or breeding birds. Structural metrics are incredibly important to measure as they inform on habitat extent and quality which impacts factors such as food, shelter and territory availability and reproductive success for all taxonomic groups. This package has selected the habitat scoring DEFRA metric, now used for mandatory Biodiversity Net Gain (BNG), as the structural metric and the non-structural metrics include species richness and abundance of breeding birds, plants, invertebrates and pollinators. By monitoring biodiversity across these variables, we generate a biodiversity value that reflects the state of nature on a given site before biodiversity enhancing interventions are carried out. So, why do we need to do this?
The Importance of a Well-designed and Thorough Baseline
Gathering robust baseline data is key to demonstrating the success of biodiversity credit funded projects, as reassessment of the same biodiversity metrics over the lifetime of the project is used to measure and verify Nature Positive outcomes associated with the interventions.. As the Wallacea Trust methodology defines a unit of biodiversity as a ‘1% uplift in biodiversity per hectare as measured by the median % change in a basket of metrics reflecting conservation objectives for a given project’, comparison of site biodiversity in 2028 to our baseline value generated in 2024 would enable project X to demonstrate a 40% increase in biodiversity across 500 hectares. If project X had been managing their farm regeneratively since 2024 to improve biodiversity this data would indicate that efforts had been successful. The landowner could then use any verified claims as they wish, whether that be to generate biodiversity credits or report on nature positivity.
Why Measure Pollinators and Detritivores?
Now that the context of the package has been framed, let’s explore why pollinators and detritivores have been selected as relevant metrics to assess on farms and estates:
Importantly, both metrics consider and reflect the conservation objectives of the farms and estates that this baselining package is designed for.
How Do We Measure Invertebrate Biodiversity?
Pan Traps for Pollinators
Pan trap stations are used to investigate the species richness and abundance of pollinators, these are made up of three different coloured bowls set to the height of adjacent vegetation and filled with soapy water called ‘preserving fluid’ (Figure 1). Our interactive smartphone app guides users to survey locations where the stations are assembled and left ‘open’ for 24 hours.
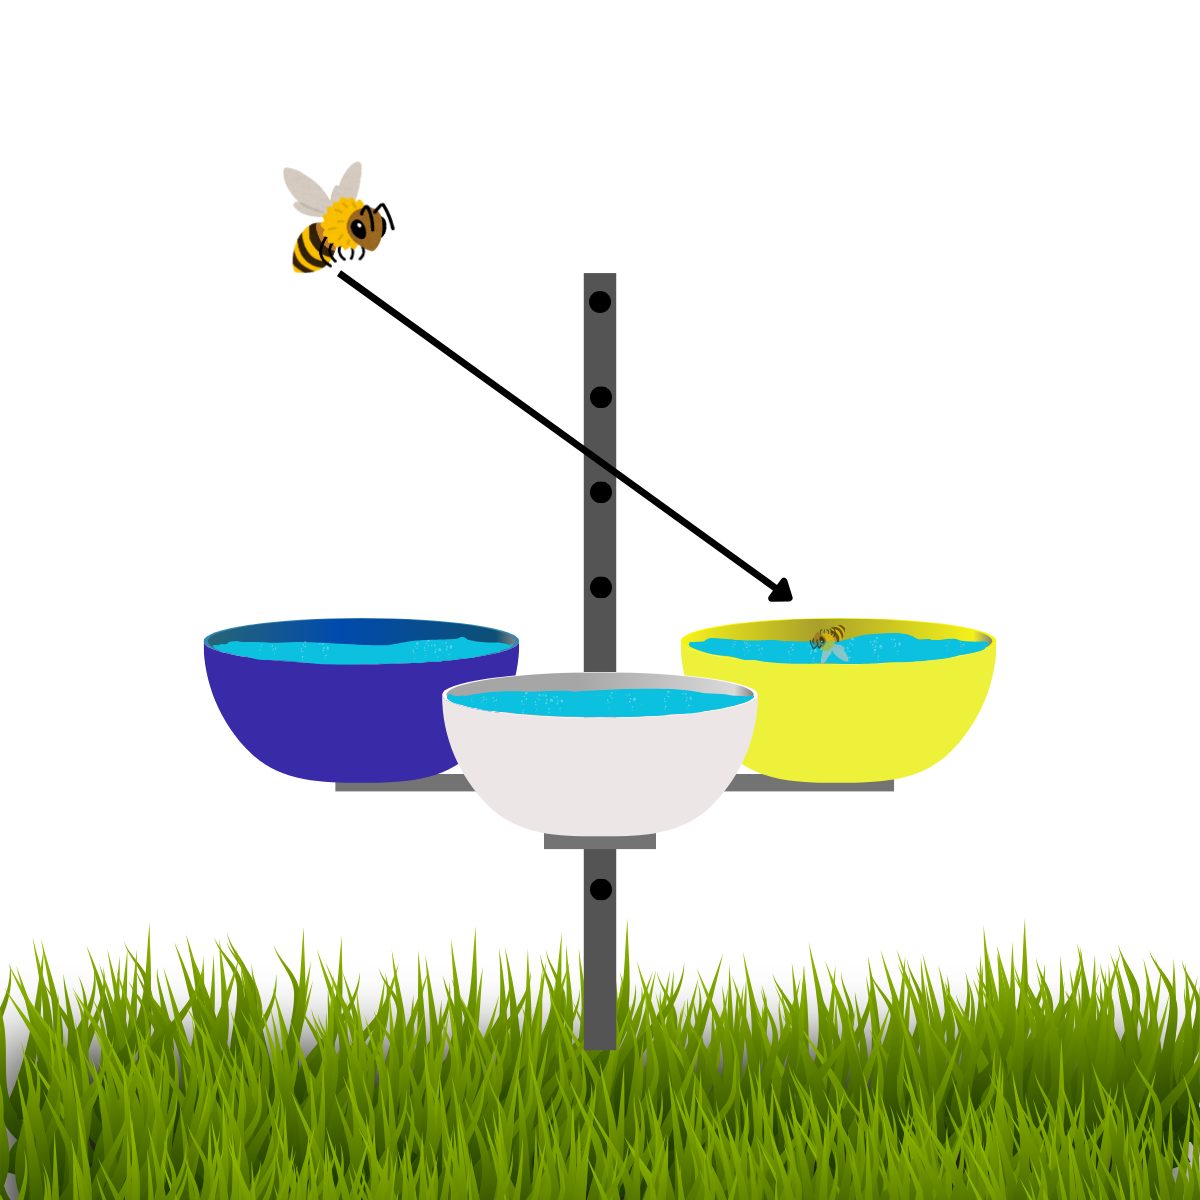
Figure 1: Pan trap. The pan trap station consists of a blue, white and yellow bowl mounted on a stand; each bowl is filled with preserving liquid. The pollinators land on the trap bowls, mistaking them for flowers, and are captured in the preserving fluid. Specimens are later collected and stored for further analysis.
The colour of the bowls in pan traps is known to influence the catch composition. Our approach follows the recommendations outlined by the UK Pollinator Scheme and are traps are comprised of UV reflective blue, yellow and white bowls. Pollinators land on the trap bowls, mistaking them for flowers, and are caught and drowned in preserving fluid. The following day specimens are collected and stored for sorting and metabarcoding which provides data on species richness and abundance, this enables the baseline biodiversity value to be calculated. If you want to learn about metabarcoding, please read our previous blog on the technique here.
Pitfall Traps for Detritivores
Pitfall traps capture ground-dwelling insects when they walk to the edge of the trap and fall in and are best suited to sampling beetles. For the traps to work, the containers must be sunken into the ground (Figure 2). Similarly to pan traps, pitfall trap containers are filled with preserving fluid that maintains the quality of any specimens captured before they are collected. Covers provide a roof over the trap and are used to:
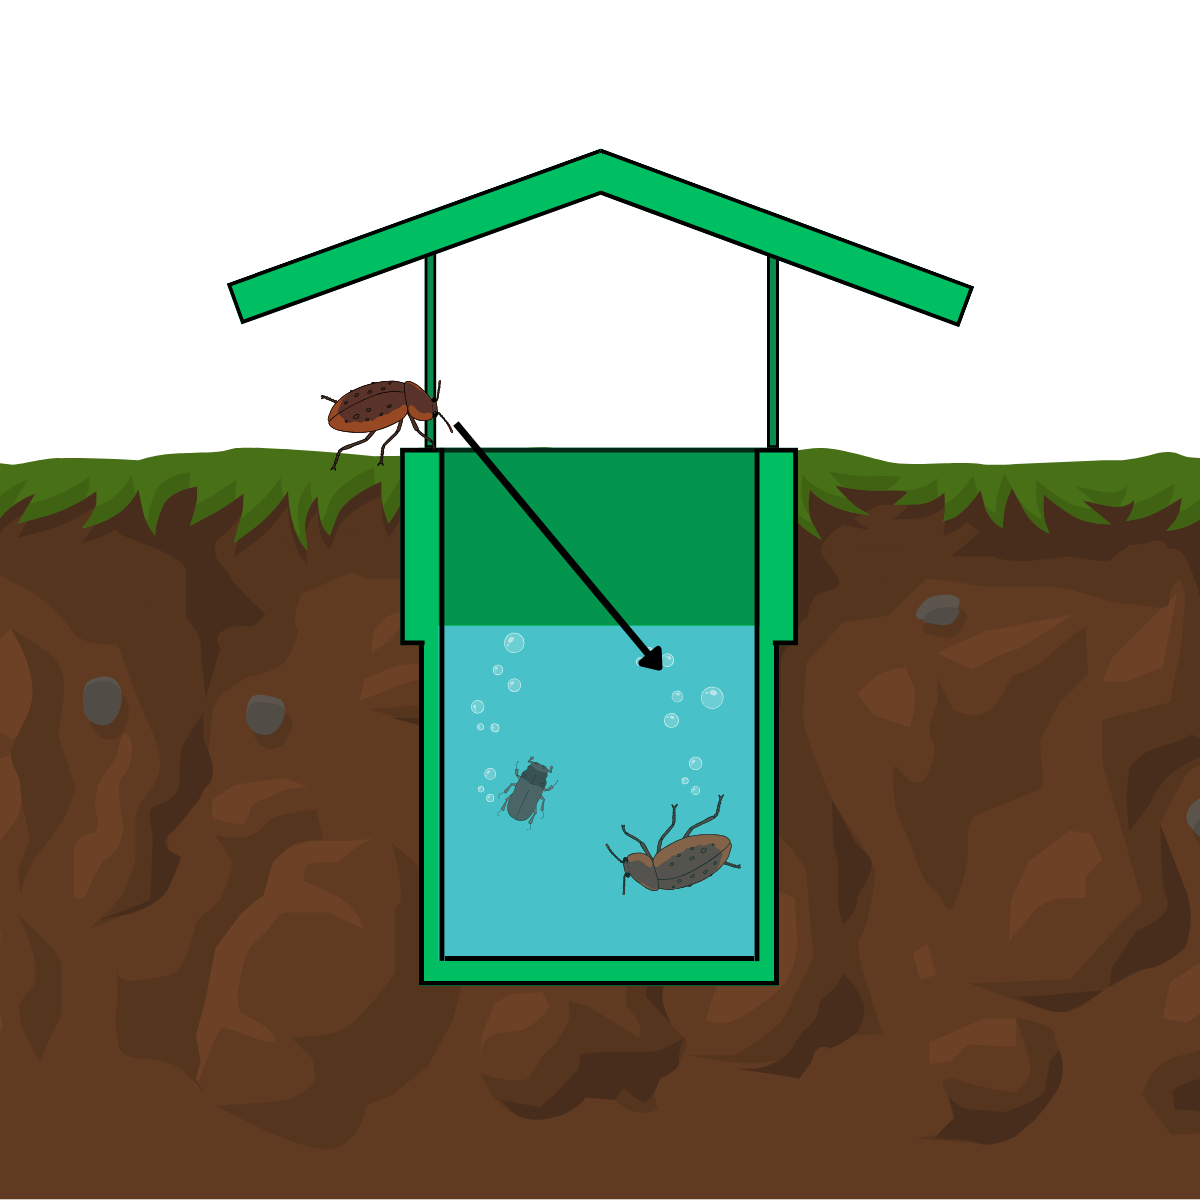
Figure 2: Pitfall trap. The pitfall trap is sunk into the ground, ground-dwelling insects fall into the preserving fluid and are later collected and stored for further analysis.
Pitfall traps spaced out at 10m intervals along a 50m transect are used to collect detritivore samples (Figure 3). Similarly to the pollinator surveys, the traps are left ‘open’ for 24 hours and the samples are then collected, stored, and sent for metabarcoding.
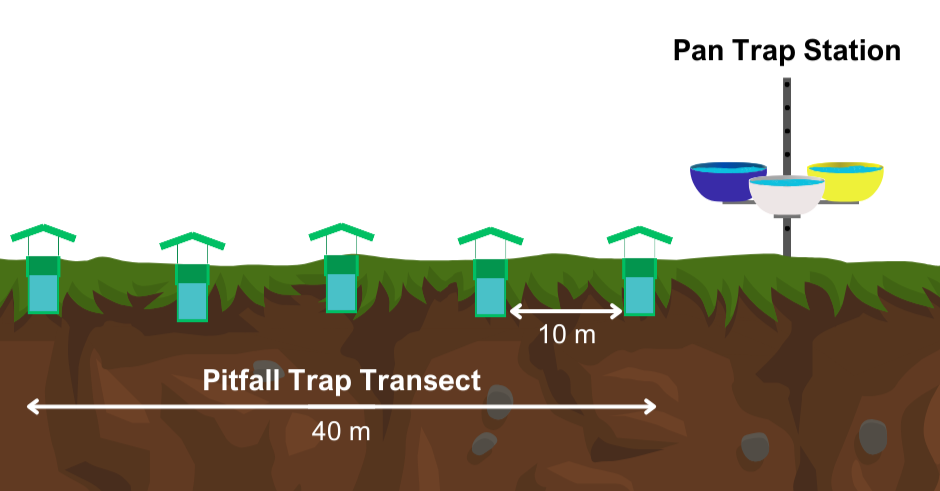
Figure 3: Invertebrate survey set up. Pan trap stations are deployed 10m from the pitfall trap transect. Pitfall traps forming the linear transect are spaced apart by 10m.
Summary
Species richness and abundance must be assessed for non-structural biodiversity metrics. How this data is gathered depends on what is being assessed, with survey methods ranging from pan or pitfall traps to quadrats and bioacoustic recordings. MRV tailored to suit each metric is essential for calculating accurate and representative baseline biodiversity.
Our biodiversity monitoring package ensures suitable metrics are chosen and monitored using appropriate survey methods. We gather data that reflects true site baselines, and this can be used to inform land management strategies for biodiversity and to enable intervention success to be quantified in the future. Opting for our approach sets biodiversity uplift projects up for success.
Watch out for the next blog of the series exploring our plant metric!